Economy & Markets

Stocks closed out 2019 on a high note. The Dow Jones Industrial Average gained 22.3% for the year, while the S&P 500 was up 28.9%, its best year since 2013. The technology-heavy Nasdaq also rose the most in six years, ending up 35.2%. All three indexes hit record highs in late December. As in the last few years, technology giants drove a big portion of the gains. Amazon, Alphabet, Facebook, Amazon and Microsoft lifted the indexes as investors continued to pile into the stocks.

Low interest rates may be partly responsible. After raising rates four times in 2018, the Federal Reserve slashed rates three times in 2019, partially easing investor fears of a recession or economic slowdown. That sets up 2020 to be a year of relative stability, with lower economic risks and low inflation. The Fed is expected to hold steady this year, and lower borrowing costs could entice consumers to make big long-term investments like buying a house. Inflation is running below the Fed's 2% target, giving the central bank plenty of incentive to keep rates low.

Positive news on the U.S. trade war with China could also be lifting stocks. The battle has been going on since early 2018 with each side slapping tariffs on hundreds of billions of dollars of each other's imports. President Trump has accused China of unfair trade practices and theft of technology and China has retaliated. But negotiators indicated some progress in late December, saying there is a so-called phase one deal that could be reached by the end of January that would reduce some U.S. tariffs in exchange for an agreement by China to buy more American agricultural products and provide protections for American technology. The U.S. also put on hold some tariffs that would have hit Chinese smartphones, toys and clothing before the holidays, and China cut some tariffs on U.S. goods. The Trump administration suggested last month that the phase one deal could be signed as early as mid-January.

Of course, that's not the end to trade woes. The Trump administration has battles open on multiple fronts. While it moved to sign a new agreement between the U.S., Mexico and Canada, the administration is also looking at tariffs on a variety of European goods such as French wine and cheese and Spanish olive oil, among others.

A strong job market and resilient consumers are also boosting stocks. Last month, the Commerce Department said economic output rose 2.1% in the last quarter of the year, about the same as the third quarter, which economists viewed as positive. A strong labor market convinced the Fed to keep interest rates unchanged at their December meeting. According to the latest figures, unemployment was 3.5% in December, sitting near a 50-year low. Disposable income rose and consumer spending also rose, a good sign for the economy. More than two-thirds of output is consumer spending.

The year's top stock sectors include, not surprisingly, technology followed by consumer discretionary and industrials. The top performing stock of the year was Advanced Micro Devices, up 148%. Lam Research (up 119%), KLA Corp. (up 103.9%), Target Corp. (up 100.1%) and Chipotle Mexican Grill (up 93.8%) rounded out the top five stocks. The energy sector was the laggard in 2019, up nearly 6%.

The year was also notable for a rotation back to value stocks, something that really picked up momentum in September. Some analysts expect this rotation to continue into 2020 because of interest rates and a turnaround in some economic indicators.

Here were some of the economic data points released as 2020 kicked off:

1. Private payrolls rose 202,000 in December, more than estimated, according to ADP and Moody's Analytics.

2. Consumer confidence dipped in December, according to the Conference Board. The economy hasn't shown signs of weakening, but consumers aren't expecting growth to gain momentum in the early part of 2020.

3. U.S. third-quarter economic growth was unrevised at 2.1% but U.S. manufacturing production rose more than expected in November.

4. Homebuilder confidence jumped to the highest level in 20 years, according to the National Association of Home Builders/Wells Fargo Housing Market Index.

Recommended Reading

There may be an explanation why value stocks rallied in September when markets were calm. A new pattern developed over the last decade where value stock performance increased when the bond yield curve steepened, according to The Wall Street Journal. And the correlation has become more pronounced recently. It could reflect investor caution about companies that might struggle to access funding during a slowdown. And investors who are worried about slow growth could be gravitating to long-term bonds, forcing yields down. Read more here and see below for links to blog posts and articles you may have missed.

Factor Focus: Morningstar found that volatility, size and momentum factors work the best out of seven strategies. Interestingly, style is near the bottom of the list. Value investing, which is perhaps the most academically supported factor, has been a disappointment according to the data. Read more

Value Caution: BlackRock's Andrew Ang tells Institutional Investor that investors should be careful about going back to the value factor, even though some influential funds like AQR and Research Affiliates have argued it's time to buy inexpensive stocks. Read more

New Economy: Oakmark Select fund manager Bill Nygren told Barron's he thinks Google and Netflix are value stocks. This shows his thinking on value as a strategy. In an asset-light economy, he is willing to look at companies that look expensive by traditional measures. Netflix is not cash flow positive, but is growing subscribers quickly and has pricing power. Read more

Team Work: The team approach seems to work better for funds. Three-person steams outperform solo run funds by 58 percentage points, according to CNBC, citing a study by Michael Mauboussin at Blue Mountain Capital. Some 75% of actively managed funds are team managed, according to Morningstar. Read more

Stock Tips: Veteran stock picker Peter Lynch recently shared some ideas on finding growth opportunities in Barron's. His best ideas were companies that had a good concept or were growth companies in non-growth industries, such as Stop & Shop and Dunkin Donuts. He also suggested it's better to get in on stocks that are just beginning their growth phase, and if you miss that window, look for turnarounds or special situations. Read more

Job Change: Berkshire Hathaway's Todd Combs took on a new job this year, becoming the chief executive of the car insurer Geico, according to WSJ. It's a big shift for the 48-year-old money manager, who helps oversee about $14 billion of Berkshire's massive investment portfolio. Read more

New Market: Rob Arnott told CNBC's Trading Nation that a major market shift is on the horizon that could be a spectacular opportunity for value investors. The chairman of Research Affiliates says a rotation to value could be critical if the economy shifts. Read more

Narrative Economics: Robert Shiller talked about his new book, Narrative Economics, in an interview with Barron's. Among the highlights, he said today's high stock valuations are about optimism and that getting over the financial crisis a decade ago required investors to forget the fear. He also admits to being ambivalent about the degree to which workers will be replaced by computers. Read more

Value Time: RAFI Indices published a paper that said it's time to increase allocations to value strategies. RAFI's strategy focuses on rebalancing out of popular stocks and into stocks whose price has fallen and become undervalued. Read more

Tech Rules: Tech giants Apple, Alphabet, Microsoft, Amazon, and Facebook contributed 20% of the S&P 500's growth last year despite all the worries about the effects of trade wars and regulatory crackdowns. Investors continued to pile into tech stocks, which seem resilient in the face of economic growth concerns. But tech's performance is remarkable because giant companies rarely see such growth. Read more

Old Timers: Some of the oldest U.S. mutual funds - dating back a century - are still performing well, according to Barron's. Central Securities, Adams Diversified Equity and General American Investors, which are all closed end funds, gained 30% last year, beating the S&P. Read more

Dividend Calculating: Barron's walked through the difficulty of calculating dividend yields on mutual funds. It's a little more complex than stocks, where you just divide the annual dividend per share by the price. Investors who rely on fund or advisor disclosures need to be aware of how the numbers are calculated. Read more

International Stocks: Owning stocks of companies in developed countries around the world offers little diversification benefit, according to an article in CFA Institute. International stocks stopped outperforming U.S. stocks about 20 years ago and have underperformed since, and the allocation to U.S. stocks has slowly drifted up. The evolution of the global economy means the relationship between international and U.S. stocks has also changed. Read more

ETF Update: Defunct ETFs hit 1,000 last year, often thinly traded funds that have wider spreads. In a sense, the whole ETF market is more of a meritocracy than mutual funds. ETFs have to attract assets from cost-obsessed picky advisors and investors, according to Bloomberg. Read more

Avoiding Recession: Advisor Perspectives recently ran an interview of Wharton School professor Jeremy Siegel. The market, he says, is trading at 19 times earnings, up from 17-18 times a year ago because of low interest rates. He also says he's more confident the U.S. will avoid a recession over the next two years. Read more

Volatility Bets: Investors shouldn't always trust calm markets, according to The Wall Street Journal. Market calm can be the result of investors betting against volatility rather than from external factors like geopolitical calm. This can blow up when all those trades unwind at the same time, as it did in early 2018. Read more

Falling Fees: Active managers have taken steps to stop the flow of investing money to passive funds, but some of what they've done has hurt rather than helped. Investors are paying half as much to own U.S. mutual funds now compared to the 1990s but it still hasn't helped. Read more

Eyeing Fundamentals: Profits, governance and price should be at the forefront of investment decision-making, according to Nir Kaissar in a recent Bloomberg article. He writes about SoftBank's recent missteps as a cautionary tale. Read more

Pearce Profile: Randy Pearce at the Grandeur Peak International Stalwarts fund was recently profiled in Barron's about how they find opportunities in the stock market. The firm has an analytics team that has generated a three-year annualized return of 12.2%, which beat most others and the benchmark. Read more

Overweight Stocks?: Fidelity's third quarter retirement report last month said Baby Boomers, who were born between 1944 and 1964, are too heavily weighted in stocks. This is the generation entering retirement now, and it's been riding a 10-year bull market. Nearly 10% of this age group is entirely invested in stocks, a risky bet. Read more


The Fallen

As we rebalance the Validea Hot List, 1 stocks leave our portfolio. These include: Criteo Sa (Adr) (CRTO).

The Keepers

9 stocks remain in the portfolio. They are: Oshkosh Corp (OSK), United Rentals, Inc. (URI), Skechers Usa Inc (SKX), Foot Locker, Inc. (FL), Bruker Corporation (BRKR), Meta Financial Group Inc. (CASH), Nk Lukoil Pao (Adr) (LUKOY), Onemain Holdings Inc (OMF) and Pennymac Financial Services Inc (PFSI).

The New Additions

We are adding 1 stocks to the portfolio. These include: Monster Beverage Corp (MNST).

Latest Changes

Additions  
MONSTER BEVERAGE CORP MNST
Deletions  
CRITEO SA (ADR) CRTO

The Perils of Market Forecasting

If it's the new year, that means it's time for analysts to publish their outlooks. That means there's a whole lot of predicting going on, but that is fraught with danger for investors. Analysts have to make a name for themselves somehow, and predicting stock movements and setting price targets for the indexes and individual stocks is one way they do that. Some make bold predictions that grab attention, while others try to walk the middle of the road. Whatever their angle, Validea's Jack Forehand shares some thoughts for how much investors should pay attention.

It's that time of year again. The time of year where all the market experts make their 2020 predictions. You will see countless forecasts about what the economy will do in 2020. You will see many experts tell you what interest rates will do next year. And most of all, you will see a variety of predictions for where the S&P 500 is heading this year. The experts making these predictions will even do you the favor of giving you exact price targets so you know exactly what will happen.

But there will be one major problem with almost all of these predictions: They will be wrong.

I could try to explain why short-term forecasting is a waste of time, but I couldn't do it any better than this quote from Jim O'Shaughnessy, the founder of O'Shaughnessy Asset Management. Here is Jim's take on short-term forecasting.

And so, from our perspective, trying to make a successful forecast, short-term forecast, is a virtual impossibility, because, in the short term, there's quite a bit of noise in the marketplace. And people mistake noise for signal, and they have a narrative about it, and it's very believable, but unfortunately, often wrong. So we don't make forecasts in terms of what the market's going to do over short periods of time because quite frankly, we don't know. And if others were honest, they would have to admit that they don't know, either.

source: https://25iq.com/2018/07/21/lessons-from-jim-oshaughnessy/

Most forecasts are made out of self-interest. The goal is more to bring attention to the forecaster than to actually benefit investors. They also follow some common themes. So as we work our way through the height of the annual forecast season, I thought it might be a good time to point out some of the tricks of the trade. Here are some types of forecasts you should watch out for.

The Calendar Year Prediction

Predicting what will happen over a one-year period in the market is very difficult. Doing it consistently is essentially impossible. Yet every year, many of the top strategies at Wall Street's most prestigious firms not only try to predict whether the market will go up or down, but they try to do it with complete accuracy by setting exact price targets. This exercise can be great for entertainment purposes, but it should have no impact on how you manage your portfolio.

To show how difficult this is to do, here are the year-end targets from analysts at some major Wall Street firms coming into 2019. As of this writing, the S&P 500 is at 3221. None of them were close. That isn't because they aren't smart or they aren't skilled. It is because they were trying to predict something that is impossible to predict.

Strategist

Firm

2019 S&P 500 Target

Mike Wilson

Morgan Stanley

2750

Saira Malik

Nuveen

2840

Rob Sharps

T Rowe Price

2850

Savita Subramanian

BoA

2900

John Praveen

PGIM

3000

David Kostin

Goldman Sachs

3000

Edward Yardeni

Yardeni Research

3100

Tobias Levkovich

Citi Research

3100

Dubravko Lakos-Bujas

J.P. Morgan

3100

Steve Auth

Federated

3100

source: Barrons, 2019 Outlook: U.S. Stocks Could Rally About 10%

The Doom and Gloom

The playbook for this one is simple. You start by predicting that the stock market is in for a major decline. You talk about things like excessive debt that will break the system or extreme overvaluations. You might even present a chart or two that you have hand picked to best support your case. Then you repeat the process every single year until the decline you have predicted eventually comes. After that, you let everyone know you saw it coming and that investors would be well served by heeding your warnings going forward. What you will ignore is the fact that the market likely went up substantially from the point of your initial prediction, and that investors who followed you lost much more money missing those gains than they saved by missing the decline.

We have seen these types of predictions throughout this bull market. Some have been making the bear case since 2009, while others jumped on at some point along the way. But the one thing they all have in common is they have been wrong. Making the negative case for stocks can generate great headlines. Anyone who does it will also ultimately be proven right at some point. But for these types of predictions to have any value, they need to not only get the timing of the decline right, but also need to come close to timing the bottom. History tells us that almost none of the market pundits who try to do this can do it successfully. And those who can are probably trading their own and their client's money and not telling everyone about it on Twitter.

The Crazy Prediction

If I want to get attention for my market call, I am not going to predict a 10% increase in the market this year. I need to predict something much bolder. That way, if I am right, I will get lots of publicity, but if I am wrong, everyone will probably forget I said it in the first place. From the perspective of getting the most attention, this approach makes sense. But from the perspective of the investor who listens to the prediction, it can be the most damaging. A good example of this are those who predicted that Bitcoin was going to $50,000 or $100,000 in a very short time when it had made its run up to $20,000. Those predictions were very unlikely to ever come true, but they had huge upside for those who made them if they worked out. And when they didn't, most people just forgot about them.

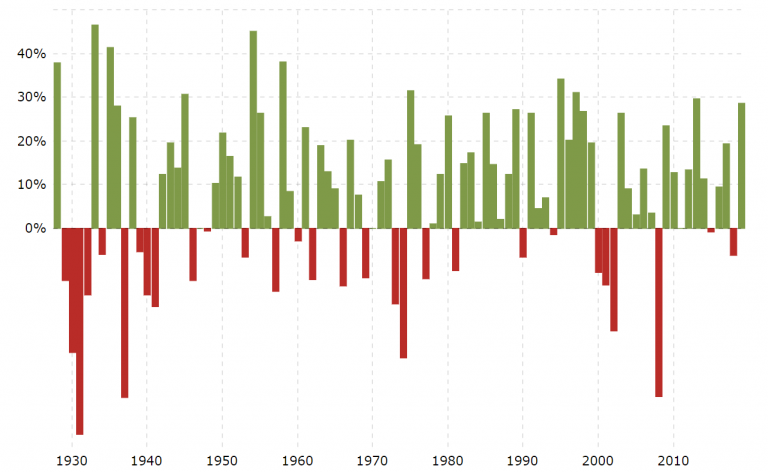
The "I Have No Idea So I Will Just Predict the Average"

This is the exact opposite of the previous one and circles back around to those year-end Wall Street analyst forecasts I talked about before. If the market averages a 10 percent return per year and you want to limit your career risk from being wrong, the best approach is to just predict something close to that. That, however, doesn't consider the variability of returns.

On average, the market returns about 10% per year over time, but the individual year returns are rarely close to that average. The chart below illustrates this concept by showing the annual returns of the S&P 500. Predicting a 10% return per year may be safe, but it is rarely correct.

source: https://www.macrotrends.net/2526/sp-500-historical-annual-returns

The Heads I Win, Tails I Also Win

The best-case scenario for a forecast is setting it up in such a way that it can't be wrong. For example, I could predict that there is a 40% chance that we will have a bear market in 2020. By making a prediction like that, I have set myself up to claim victory no matter what happens. The odds of a bear market in any given year have been less than 40% historically. So if we get one, I can say that I called for above average odds of a bear market. But 40% is still less than an even bet. So if we don't, I can talk about how I predicted a less than 50% chance of a bear market. Either way, I win. Either way, I get to say I was right.

The Dangers of Predicting the Unpredictable

These are just a few examples of the type of market forecasts I have seen. The one thing they all have in common is that they should be looked at as entertainment and not as a reason to make any changes in your portfolio. So as you read this year's market forecasts, keep in mind that while they may be interesting, and may seem compelling when you read them, they will likely have limited value in telling you what is likely to happen in the future.

New to the Hot List

Monster Beverage Corp. (MNST) - This soft drink maker scores highly on the models tracking the style of Warren Buffett and Partha Mohanram.

News on Hot List Stocks

Russia's crude oil production could rise to more than 12 million barrels per day by 2035 if global demand continues to grow, according to a forecast by Lukoil.

United Rentals should benefit from the positive construction market outlook as well as its strong technological and digital capabilities, according to Zacks Equity Research.


Portfolio Holdings
Ticker Date Added Return
LUKOY 4/5/2019 17.0%
PFSI 8/23/2019 18.2%
FL 12/13/2019 3.8%
OMF 8/23/2019 9.3%
BRKR 11/15/2019 3.6%
CASH 11/15/2019 17.8%
OSK 11/15/2019 2.7%
SKX 12/13/2019 2.9%
URI 11/15/2019 5.8%
MNST 1/10/2020 TBD


Guru Analysis
Disclaimer: The analysis is from Validea's selection and interpretation of content from the guru's book or published writings, and is not from nor endorsed by the guru. See Full Disclaimer

LUKOY  |   PFSI  |   FL  |   OMF  |   BRKR  |   CASH  |   OSK  |   SKX  |   URI  |   MNST  |  

NK LUKOIL PAO (ADR)

Strategy: Growth Investor
Based on: Martin Zweig

NK Lukoil PAO is an energy company. The primary activities of LUKOIL and its subsidiaries are oil exploration, production, refining, marketing and distribution. Its segments include Exploration and Production; Refining, Marketing and Distribution, and Corporate and other. The Exploration and Production segment includes its exploration, development and production operations related to crude oil and gas. These activities are located within Russia, with additional activities in Azerbaijan, Kazakhstan, Uzbekistan, the Middle East, Northern and Western Africa, Norway, Romania and Mexico. The Refining, Marketing and Distribution segment includes refining, petrochemical and transport operations, marketing and trading of crude oil, natural gas and refined products, generation, transportation and sales of electricity, heat and related services. The Corporate and other segment includes operations related to finance activities, production of diamonds and certain other activities.


P/E RATIO: PASS

The P/E of a company must be greater than 5 to eliminate weak companies, but not more than 3 times the current Market P/E because the situation is much too risky, and never greater than 43. LUKOY's P/E is 6.51, based on trailing 12 month earnings, while the current market PE is 21.00. Therefore, it passes the first test.


REVENUE GROWTH IN RELATION TO EPS GROWTH: FAIL

Revenue Growth must not be substantially less than earnings growth. For earnings to continue to grow over time they must be supported by a comparable or better sales growth rate and not just by cost cutting or other non-sales measures. LUKOY's revenue growth is 6.63%, while it's earnings growth rate is 15.73%, based on the average of the 3, 4 and 5 year historical eps growth rates. Therefore, LUKOY fails this criterion.


SALES GROWTH RATE: PASS

Another important issue regarding sales growth is that the rate of quarterly sales growth is rising. To evaluate this, the change from this quarter last year to the present quarter (-2.7%) must be examined, and then compared to the previous quarter last year compared to the previous quarter (-15.3%) of the current year. Sales growth for the prior must be greater than the latter. For LUKOY this criterion has been met.


The earnings numbers of a company should be examined from various different angles. Three of these angles are stability in the trend of earnings, earnings persistence, and earnings acceleration. To evaluate stability, the stock has to pass the following four criteria.


CURRENT QUARTER EARNINGS: PASS

The first of these criteria is that the current EPS be positive. LUKOY's EPS ($4.65) pass this test.


QUARTERLY EARNINGS ONE YEAR AGO: PASS

The EPS for the quarter one year ago must be positive. LUKOY's EPS for this quarter last year ($3.55) pass this test.


POSITIVE EARNINGS GROWTH RATE FOR CURRENT QUARTER: PASS

The growth rate of the current quarter's earnings compared to the same quarter a year ago must also be positive. LUKOY's growth rate of 30.99% passes this test.


EARNINGS GROWTH RATE FOR THE PAST SEVERAL QUARTERS: PASS

Compare the earnings growth rate of the previous three quarters with long-term EPS growth rate. Earnings growth in the previous 3 quarters should be at least half of the long-term EPS growth rate. Half of the long-term EPS growth rate for LUKOY is 7.87%. This should be less than the growth rates for the 3 previous quarters, which are 36.99%, 14.02%, and 11.46%. LUKOY passes this test, which means that it has good, reasonably steady earnings.


This strategy looks at the rate which earnings grow and evaluates this rate of growth from different angles. The 4 tests immediately following are detailed below.


EPS GROWTH FOR CURRENT QUARTER MUST BE GREATER THAN PRIOR 3 QUARTERS: PASS

If the growth rate of the prior three quarter's earnings, 18.47%, (versus the same three quarters a year earlier) is less than the growth rate of the current quarter earnings, 30.99%, (versus the same quarter one year ago) then the stock passes.


EPS GROWTH FOR CURRENT QUARTER MUST BE GREATER THAN THE HISTORICAL GROWTH RATE: PASS

The EPS growth rate for the current quarter, 30.99% must be greater than or equal to the historical growth which is 15.73%. LUKOY would therefore pass this test.


EARNINGS PERSISTENCE: FAIL

Companies must show persistent yearly earnings growth. To fulfill this requirement a company's earnings must increase each year for a five year period. LUKOY, whose annual EPS growth before extraordinary items for the previous 5 years (from the earliest to the most recent fiscal year) were 8.69, 6.50, 4.65, 9.45, and 13.87, fails this test.


LONG-TERM EPS GROWTH: PASS

One final earnings test required is that the long-term earnings growth rate must be at least 15% per year. LUKOY's long-term growth rate of 15.73%, based on the average of the 3, 4 and 5 year historical eps growth rates, passes this test.


TOTAL DEBT/EQUITY RATIO: PASS

A final criterion is that a company must not have a high level of debt. A high level of total debt, due to high interest expenses, can have a very negative effect on earnings if business moderately turns down. If a company does have a high level, an investor may want to avoid this stock altogether. LUKOY's Debt/Equity (14.99%) is not considered high relative to its industry (51.94%) and passes this test.


INSIDER TRANSACTIONS: PASS

A factor that adds to a stock's attractiveness is if insider buy transactions number 3 or more, while insider sell transactions are zero. Zweig calls this an insider buy signal. For LUKOY, this criterion has not been met (insider sell transactions are 0, while insiders buying number 0). Despite the lack of an insider buy signal, there also is not an insider sell signal, so the stock passes this criterion.


PENNYMAC FINANCIAL SERVICES INC

Strategy: Price/Sales Investor
Based on: Kenneth Fisher

PennyMac Financial Services, Inc. is a specialty financial services firm. The Company conducts business in three segments: production, servicing (together, production and servicing comprise its mortgage banking activities) and investment management. Production segment performs mortgage loan origination, acquisition and sale activities. Servicing segment performs mortgage loan servicing for its own account and for others, including for PennyMac Mortgage Investment Trust (PMT). Investment management segment represents its investment management activities, which include the activities associated with investment asset acquisitions and dispositions, such as sourcing, due diligence, negotiation and settlement; managing correspondent production activities for PMT; and managing the acquired investments for PMT. Its primary subsidiaries are: PNMAC Capital Management, LLC, PennyMac Loan Services, LLC and PNMAC Opportunity Fund Associates, LLC.


PRICE/SALES RATIO: PASS

The prospective company should have a low Price/Sales ratio. Non-cyclical (non-Smokestack) companies with Price/Sales ratio between .75 and 1.5 are good values. PFSI's P/S ratio of 1.36 based on trailing 12 month sales, falls within the "good values" range for non-cyclical companies and is considered attractive.


PRICE/RESEARCH RATIO: PASS

This methodology considers companies in the Technology and Medical sectors to be attractive if they have low Price/Research ratios. PFSI is neither a Technology nor Medical company. Therefore the Price/Research ratio is not available and, hence, not much emphasis should be placed on this particular variable.


PRELIMINARY GRADE: No Interest in PFSI At this Point

Is PFSI a "Super Stock"? NO


Price/Sales Ratio: FAIL

The Price/Sales ratio is the most important variable according to this methodology. The prospective company should have a low Price/Sales ratio. PFSI's Price/Sales ratio of 1.36 does not pass this criterion.


LONG-TERM EPS GROWTH RATE: PASS

This methodology looks for companies that have an inflation adjusted EPS growth rate greater than 15%. PFSI's inflation adjusted EPS growth rate of 43.87% passes this test.


FREE CASH PER SHARE: PASS

This methodology looks for companies that have a positive free cash per share. Companies should have enough free cash available to sustain three years of losses. This is based on the premise that companies without cash will soon be out of business. PFSI's free cash per share of 8.60 passes this criterion.


THREE YEAR AVERAGE NET PROFIT MARGIN: PASS

This methodology looks for companies that have an average net profit margin of 5% or greater over a three year period. PFSI's three year net profit margin, which averages 6.17%, passes this criterion.


FOOT LOCKER, INC.

Strategy: Contrarian Investor
Based on: David Dreman

Foot Locker, Inc. is a retailer of shoes and apparel. The Company operates through two segments: Athletic Stores and Direct-to-Customers. The Company is an athletic footwear and apparel retailer, which include businesses, such as include Foot Locker, Kids Foot Locker, Lady Foot Locker, Champs Sports, Footaction, Runners Point, Sidestep and SIX:02. The Direct-to-Customers segment is multi-branded and sells directly to customers through Internet and mobile sites and catalogs. The Direct-to-Customers segment operates the Websites for eastbay.com, final-score.com, eastbayteamsales.com and sp24.com. Additionally, this segment includes the Websites, both desktop and mobile, aligned with the brand names of its store banners (footlocker.com, ladyfootlocker.com, six02.com kidsfootlocker.com, champssports.com, footaction.com, footlocker.ca, footlocker.eu, runnerspoint.com and sidestep-shoes.com).

MARKET CAP: PASS

Medium to large-sized companies (the largest 1500 companies) should be chosen, because they are more in the public eye. Furthermore, the investor is exposed to less risk of "accounting gimmickry", and companies of this size have more staying power. FL has a market cap of $4,030 million, therefore passing the test.


EARNINGS TREND: PASS

A company should show a rising trend in the reported earnings for the most recent quarters. FL's EPS for the past 2 quarters, (from earliest to most recent quarter) 0.56, 1.17 have been increasing, and therefore the company passes this test.


EPS GROWTH RATE IN THE IMMEDIATE PAST AND FUTURE: FAIL

This methodology likes to see companies with an EPS growth rate higher than the S&P in the immediate past and a likelihood that this trend will continue in the near future. FL fails this test as its EPS growth rate for the past 6 months (-23.02%) does not beat that of the S&P (7.68%).


This methodology would utilize four separate criteria to determine if FL is a contrarian stock. In order to eliminate weak companies we have stipulated that the stock should pass at least two of the following four major criteria in order to receive "Some Interest".


P/E RATIO: PASS

The P/E of a company should be in the bottom 20% of the overall market. FL's P/E of 8.37, based on trailing 12 month earnings, meets the bottom 20% criterion (below 11.42), and therefore passes this test.


PRICE/CASH FLOW (P/CF) RATIO: PASS

The P/CF of a company should be in the bottom 20% of the overall market. FL's P/CF of 5.86 meets the bottom 20% criterion (below 6.24) and therefore passes this test.


PRICE/BOOK (P/B) VALUE: FAIL

The P/B value of a company should be in the bottom 20% of the overall market. FL's P/B is currently 1.80, which does not meet the bottom 20% criterion (below 0.96), and it therefore fails this test.


PRICE/DIVIDEND (P/D) RATIO: FAIL

The P/D ratio for a company should be in the bottom 20% of the overall market (that is the yield should be in the top 20%). FL's P/D of 25.38 does not meet the bottom 20% criterion (below 19.19), and it therefore fails this test.


This methodology maintains that investors should look for as many healthy financial ratios as possible to ascertain the financial strength of the company. These criteria are detailed below.


CURRENT RATIO: PASS

A prospective company must have a strong Current Ratio (greater than or equal to the average of it's industry [1.58] or greater than 2). This is one identifier of financially strong companies, according to this methodology. FL's current ratio of 1.90 passes the test.


PAYOUT RATIO: FAIL

A good indicator that a company has the ability to raise its dividend is a low payout ratio. The payout ratio for FL is 31.77%, while its historical payout ratio has been 30.63%. Therefore, it fails the payout criterion.


RETURN ON EQUITY: PASS

The company should have a high ROE, as this helps to ensure that there are no structural flaws in the company. This methodology feels that the ROE should be greater than the top one third of ROE from among the top 1500 large cap stocks, which is 16.48%, and would consider anything over 27% to be staggering. The ROE for FL of 21.03% is high enough to pass this criterion.


PRE-TAX PROFIT MARGINS: PASS

This methodology looks for pre-tax profit margins of at least 8%, and considers anything over 22% to be phenomenal. FL's pre-tax profit margin is 8.85%, thus passing this criterion.


YIELD: PASS

The company in question should have a yield that is high and that can be maintained or increased. FL's current yield is 3.94%, while the market yield is 2.61%. FL passes this test.


LOOK AT THE TOTAL DEBT/EQUITY: PASS

The company must have a low Debt/Equity ratio, which indicates a strong balance sheet. The Debt/Equity ratio should not be greater than 20% or should be less than the average Debt/Equity for its industry of 55.42%. FL's Total Debt/Equity of 5.03% is considered acceptable.


ONEMAIN HOLDINGS INC

Strategy: Small-Cap Growth Investor
Based on: Motley Fool

OneMain Holdings, Inc. is a financial services holding company. The Company is a consumer finance company, which is engaged in providing personal loan products; credit and non-credit insurance, and service loans owned by it and service or subservice loans owned by third-parties. The Company's segments include Consumer and Insurance; Acquisitions and Servicing; Real Estate, and Other. It is engaged in pursuing strategic acquisitions and dispositions of assets and businesses, including loan portfolios or other financial assets. The Company originates and services personal loans (secured and unsecured) through two business divisions: branch operations and centralized operations. As of December 31, 2016, its combined branch operations included over 1,800 branch offices in 44 states. It offers optional credit insurance products to its customers, including credit life insurance, credit disability insurance, credit involuntary unemployment insurance and collateral protection insurance.


PROFIT MARGIN: PASS

This methodology seeks companies with a minimum trailing 12 month after tax profit margin of 7%. The companies that pass this criterion have strong positions within their respective industries and offer greater shareholder returns. A true test of the quality of a company is that they can sustain this margin. OMF's profit margin of 16.47% passes this test.


RELATIVE STRENGTH: FAIL

The investor must look at the relative strength of the company in question. Companies whose relative strength is 90 or above (that is, the company outperforms 90% or more of the market for the past year), are considered attractive. Companies whose price has been rising much quicker than the market tend to keep rising. Although OMF's relative strength of 89 is below the acceptable level, yet it is very close. Keep an eye on the stock as it could move into the acceptable range.


COMPARE SALES AND EPS GROWTH TO THE SAME PERIOD LAST YEAR: FAIL

Companies must demonstrate both revenue and net income growth of at least 25% as compared to the prior year. These growth rates give you the dynamic companies that you are looking for. These rates for OMF (66.97% for EPS, and 13.56% for Sales) are not good enough to pass.


INSIDER HOLDINGS: FAIL

OMF's insiders should own at least 10% (they own 3.56%) of the company's outstanding shares. This does not satisfy the minimum requirement, and companies that do not pass this criteria are less attractive.


CASH FLOW FROM OPERATIONS: PASS

A positive cash flow is typically used for internal expansion, acquisitions, dividend payments, etc. A company that generates rather than consumes cash is in much better shape to fund such activities on their own, rather than needing to borrow funds to do so. OMF's free cash flow of $15.04 per share passes this test.


PROFIT MARGIN CONSISTENCY: FAIL

The profit margin in the past must be consistently increasing. The profit margin of OMF has been inconsistent in the past three years (Current year: 10.54%, Last year: 4.83%, Two years ago: 5.51%), which is unacceptable. This inconsistency will carryover directly to the company's bottom line, or earnings per share.


R&D AS A PERCENTAGE OF SALES: NEUTRAL

This criterion is not critically important for companies that are not high-tech or medical stocks because they are not as R&D dependant as companies within those sectors. Not much emphasis should be placed on this test in OMF's case.


CASH AND CASH EQUIVALENTS: PASS

OMF has a large amount of cash $679.0 million on hand. Although this criteria does not apply to companies of this size, we define anything greater than $500 million in cash as having 'a lot of cash' to allow analysis of these companies. A company like OMF has the ability to pay off debt (if it has any) or acquire other companies. Most importantly, good operations generate cash.


"THE FOOL RATIO" (P/E TO GROWTH): PASS

The "Fool Ratio" is an extremely important aspect of this analysis. If the company has attractive fundamentals and its Fool Ratio is 0.5 or less (OMF's is 0.22), the shares are looked upon favorably. These high quality companies can often wind up as the biggest winners. OMF passes this test.

The following criteria for OMF are less important which means you would place less emphasis on them when making your investment decision using this strategy:

AVERAGE SHARES OUTSTANDING: PASS

OMF has not been significantly increasing the number of shares outstanding within recent years which is a good sign. OMF currently has 136.0 million shares outstanding. This means the company is not taking any measures, with regards to the number of shares, that will dilute or devalue the stock.


SALES: FAIL

Companies with sales less than $500 million should be chosen. It is among these small-cap stocks that investors can find "an uncut gem", ones that institutions won't be able to buy yet. OMF's sales of $4,627.0 million based on trailing 12 month sales, are too high and would therefore fail the test. It is companies with $500 million or less in sales that are most likely to double or triple in size in the next few years.


DAILY DOLLAR VOLUME: PASS

OMF passes the Daily Dollar Volume (DDV of $22.1 million) test. It is required that this number be less than $25 million because these are the stocks that remain relatively undiscovered by institutions. "You'll be scoring touchdowns against the big guys on your turf."


PRICE: PASS

This is a very insignificant criterion for this methodology. But basically, low prices are chosen because "small numbers multiply more rapidly than large ones" and the potential for big returns expands. OMF with a price of $41.67 passes the price test, even though it doesn't fall in the preferred range. The price should be above $7 in order to eliminate penny stocks and below $20 since most stocks in this price range are undiscovered by the institutions.


INCOME TAX PERCENTAGE: PASS

OMF's income tax paid expressed as a percentage of pretax income this year was (28.37%) and last year (38.75%) are greater than 20% which is an acceptable level. If the tax rate is below 20% this could mean that the earnings that were reported were unrealistically inflated due to the lower level of income tax paid. This is a concern.


BRUKER CORPORATION

Strategy: P/E/Growth Investor
Based on: Peter Lynch

Bruker Corporation designs and manufactures scientific instruments, and analytical and diagnostic solutions. Its segments include the Bruker BioSpin Group; the Bruker Chemicals, Applied Markets, Life Science, In-Vitro Diagnostics, Detection (CALID) Group; the Bruker Nano Group, and the Bruker Energy & Supercon Technologies (BEST) Segment. The Bruker BioSpin Group segment designs, manufactures and distributes enabling life science tools. The Bruker CALID segment designs, manufactures and distributes life science mass spectrometry instruments that can be integrated and used along with other sample preparation or chromatography instruments, as well as chemical, biological, radiological, nuclear and explosive detection products. The Bruker Nano segment designs, manufactures and distributes spectroscopy and microscopy instruments. The BEST segment develops and manufactures superconducting and non-superconducting materials and devices. It also focuses on nanomechanical testing instruments.


DETERMINE THE CLASSIFICATION:

This methodology would consider BRKR a "fast-grower".


P/E/GROWTH RATIO: FAIL

The investor should examine the P/E (38.90) relative to the growth rate (25.93%), based on the average of the 3, 4 and 5 year historical eps growth rates, for a company. This is a quick way of determining the fairness of the price. In this particular case, the P/E/G ratio for BRKR (1.50) is too high to add to the attractiveness of the stock.


SALES AND P/E RATIO: PASS

For companies with sales greater than $1 billion, this methodology likes to see that the P/E ratio remain below 40. Large companies can have a difficult time maintaining a growth high enough to support a P/E above this threshold. BRKR, whose sales are $2,026.3 million, needs to have a P/E below 40 to pass this criterion. BRKR's P/E of (38.90) is considered acceptable.


INVENTORY TO SALES: PASS

When inventories increase faster than sales, it is a red flag. However an increase of up to 5% is considered bearable if all other ratios appear attractive. Inventory to sales for BRKR was 27.53% last year, while for this year it is 26.88%. Since inventory to sales has decreased from last year by -0.65%, BRKR passes this test.


EPS GROWTH RATE: PASS

This methodology favors companies that have several years of fast earnings growth, as these companies have a proven formula for growth that in many cases can continue many more years. This methodology likes to see earnings growth in the range of 20% to 50%, as earnings growth over 50% may be unsustainable. The EPS growth rate for BRKR is 25.9%, based on the average of the 3, 4 and 5 year historical eps growth rates, which is acceptable.


TOTAL DEBT/EQUITY RATIO: PASS

This methodology would consider the Debt/Equity ratio for BRKR (61.38%) to be mediocre. If the Debt/Equity ratio is this high, the other ratios and financial statistics for BRKR should be good enough to compensate.


FREE CASH FLOW: NEUTRAL

The Free Cash Flow/Price ratio, though not a requirement, is considered a bonus if it is above 35%. A positive Cash Flow (the higher the better) separates a wonderfully reliable investment from a shaky one. This methodology prefers not to invest in companies that rely heavily on capital spending. This ratio for BRKR (2.05%) is too low to add to the attractiveness of the stock. Keep in mind, however, that it does not adversely affect the company as it is a bonus criteria.


NET CASH POSITION: NEUTRAL

Another bonus for a company is having a Net Cash/Price ratio above 30%. Lynch defines net cash as cash and marketable securities minus long term debt. According to this methodology, a high value for this ratio dramatically cuts down on the risk of the security. The Net Cash/Price ratio for BRKR (-2.45%) is too low to add to the attractiveness of this company. Keep in mind, however, that it does not adversely affect the company as it is a bonus criteria.


META FINANCIAL GROUP INC.

Strategy: Growth Investor
Based on: Martin Zweig

Meta Financial Group, Inc. is a unitary savings and loan holding company. The Company operates through its banking subsidiary, MetaBank (the Bank). Its segments include Payments, Banking, and Corporate Services/Other. MetaBank is both a community-oriented financial institution offering a range of financial services to meet the needs of the communities it serves and a payments company providing services on a nationwide basis. It operates in both the banking and payments industries through MetaBank, its retail banking operation; Meta Payment Systems (MPS), its electronic payments division; AFS/IBEX Financial Services Inc. (AFS/IBEX), its insurance premium financing division, and Refund Advantage, EPS Financial, LLC (EPS) Financial and Specialty Consumer Services, its tax-related financial solutions divisions. The Company, through its Meta Commercial Finance Division, which includes its state-chartered bank subsidiary, Crestmark Bank, provides business-to-business commercial financing.


P/E RATIO: PASS

The P/E of a company must be greater than 5 to eliminate weak companies, but not more than 3 times the current Market P/E because the situation is much too risky, and never greater than 43. CASH's P/E is 15.39, based on trailing 12 month earnings, while the current market PE is 21.00. Therefore, it passes the first test.


REVENUE GROWTH IN RELATION TO EPS GROWTH: PASS

Revenue Growth must not be substantially less than earnings growth. For earnings to continue to grow over time they must be supported by a comparable or better sales growth rate and not just by cost cutting or other non-sales measures. CASH's revenue growth is 51.98%, while it's earnings growth rate is 25.74%, based on the average of the 3, 4 and 5 year historical eps growth rates. Therefore, CASH passes this criterion.


SALES GROWTH RATE: FAIL

Another important issue regarding sales growth is that the rate of quarterly sales growth is rising. To evaluate this, the change from this quarter last year to the present quarter (34.3%) must be examined, and then compared to the previous quarter last year compared to the previous quarter (139.4%) of the current year. Sales growth for the prior must be greater than the latter. For CASH this criterion has not been met and fails this test.


The earnings numbers of a company should be examined from various different angles. Three of these angles are stability in the trend of earnings, earnings persistence, and earnings acceleration. To evaluate stability, the stock has to pass the following four criteria.


CURRENT QUARTER EARNINGS: PASS

The first of these criteria is that the current EPS be positive. CASH's EPS ($0.53) pass this test.


QUARTERLY EARNINGS ONE YEAR AGO: PASS

The EPS for the quarter one year ago must be positive. CASH's EPS for this quarter last year ($0.12) pass this test.


POSITIVE EARNINGS GROWTH RATE FOR CURRENT QUARTER: PASS

The growth rate of the current quarter's earnings compared to the same quarter a year ago must also be positive. CASH's growth rate of 341.67% passes this test.


EARNINGS GROWTH RATE FOR THE PAST SEVERAL QUARTERS: FAIL

Compare the earnings growth rate of the previous three quarters with long-term EPS growth rate. Earnings growth in the previous 3 quarters should be at least half of the long-term EPS growth rate. Half of the long-term EPS growth rate for CASH is 12.87%. This should be less than the growth rates for the 3 previous quarters which are 39.29%, -28.95% and 226.09%. CASH does not pass this test, which means that it does not have good, reasonably steady earnings.


This strategy looks at the rate which earnings grow and evaluates this rate of growth from different angles. The 4 tests immediately following are detailed below.


EPS GROWTH FOR CURRENT QUARTER MUST BE GREATER THAN PRIOR 3 QUARTERS: PASS

If the growth rate of the prior three quarter's earnings, 18.18%, (versus the same three quarters a year earlier) is less than the growth rate of the current quarter earnings, 341.67%, (versus the same quarter one year ago) then the stock passes.


EPS GROWTH FOR CURRENT QUARTER MUST BE GREATER THAN THE HISTORICAL GROWTH RATE: PASS

The EPS growth rate for the current quarter, 341.67% must be greater than or equal to the historical growth which is 25.74%. CASH would therefore pass this test.


EARNINGS PERSISTENCE: PASS

Companies must show persistent yearly earnings growth. To fulfill this requirement a company's earnings must increase each year for a five year period. CASH, whose annual EPS growth before extraordinary items for the previous 5 years (from the earliest to the most recent fiscal year) were 0.89, 1.31, 1.62, 1.70 and 2.49, passes this test.


LONG-TERM EPS GROWTH: PASS

One final earnings test required is that the long-term earnings growth rate must be at least 15% per year. CASH's long-term growth rate of 25.74%, based on the average of the 3, 4 and 5 year historical eps growth rates, passes this test.


INSIDER TRANSACTIONS: PASS

A factor that adds to a stock's attractiveness is if insider buy transactions number 3 or more, while insider sell transactions are zero. Zweig calls this an insider buy signal. For CASH, this criterion has not been met (insider sell transactions are 12, while insiders buying number 15). Despite the lack of an insider buy signal, there also is not an insider sell signal, so the stock passes this criterion.


OSHKOSH CORP

Strategy: Growth/Value Investor
Based on: James P. O'Shaughnessy

Oshkosh Corp is a designer, manufacturer and marketer of a broad range of engineered specialty vehicles and vehicle bodies. The Company operates through four segments: access equipment, defense, fire & emergency and commercial. Access equipment segment designs and manufactures aerial work platforms and telehandlers used in a wide variety of construction, industrial, institutional and general maintenance applications and also manufactures towing and recovery equipment in the United States. Defense segment manufactures heavy, medium, and light tactical wheeled vehicles. Fire & emergency segment designs and manufactures fire apparatus assembled on custom chassis, aircraft rescue and firefighting vehicles to domestic and international airports and broadcast and communication vehicles. Commercial segment designs and manufactures front- and rear-discharge concrete mixers and portable and stationary concrete batch plants, refuse collection vehicles and field service vehicles.


MARKET CAP: PASS

The first requirement of the Cornerstone Growth Strategy is that the company has a market capitalization of at least $150 million. This will screen out the companies that are too illiquid for most investors, but still include a small growth company. OSK, with a market cap of $6,369 million, passes this criterion.


EARNINGS PER SHARE PERSISTENCE: PASS

The Cornerstone Growth methodology looks for companies that show persistent earnings growth without regard to magnitude. To fulfill this requirement, a company's earnings must increase each year for a five year period. OSK, whose annual EPS before extraordinary items for the last 5 years (from earliest to the most recent fiscal year) were 2.90, 2.91, 3.77, 6.15 and 8.31, passes this test.


PRICE/SALES RATIO: PASS

The Price/Sales ratio should be below 1.5. This value criterion, coupled with the growth criterion, identify growth stocks that are still cheap to buy. OSK's Price/Sales ratio of 0.76, based on trailing 12 month sales, passes this criterion.


RELATIVE STRENGTH: PASS

The final criterion for the Cornerstone Growth Strategy requires that the Relative Strength of the company be among the top 50 of the stocks screened using the previous criterion. This gives you the opportunity to buy the growth stocks you are searching for just as the market is embracing them. OSK, whose relative strength is 82, is in the top 50 and would pass this last criterion.


SKECHERS USA INC

Strategy: Growth Investor
Based on: Martin Zweig

Skechers U.S.A., Inc. is a designer and marketer of Skechers-branded lifestyle footwear for men, women and children, and performance footwear for men and women under the Skechers Performance brand name. It also offers apparel, accessories, eyewear, scrubs and other merchandise. It sells its footwear in department, specialty and independent stores, as well as through its Skechers retail stores and online at skechers.com. The Company operates through three segments: domestic wholesale sales, international wholesale sales, and retail sales, which includes e-commerce sales. Its lifestyle brands include Skechers USA, Skechers Sport, and Skechers Active and Skechers Sport Active. Its Performance Brands include Skechers Performance, Skechers Kids and Skechers Work. As of December 31, 2017, the Company's products are available in over 170 countries and territories through its network of subsidiaries in Asia, Europe, Canada, Central America and South America.


P/E RATIO: PASS

The P/E of a company must be greater than 5 to eliminate weak companies, but not more than 3 times the current Market P/E because the situation is much too risky, and never greater than 43. SKX's P/E is 19.74, based on trailing 12 month earnings, while the current market PE is 21.00. Therefore, it passes the first test.


REVENUE GROWTH IN RELATION TO EPS GROWTH: FAIL

Revenue Growth must not be substantially less than earnings growth. For earnings to continue to grow over time they must be supported by a comparable or better sales growth rate and not just by cost cutting or other non-sales measures. SKX's revenue growth is 17.38%, while it's earnings growth rate is 21.77%, based on the average of the 3, 4 and 5 year historical eps growth rates. Therefore, SKX fails this criterion.


SALES GROWTH RATE: PASS

Another important issue regarding sales growth is that the rate of quarterly sales growth is rising. To evaluate this, the change from this quarter last year to the present quarter (15.1%) must be examined, and then compared to the previous quarter last year compared to the previous quarter (10.9%) of the current year. Sales growth for the prior must be greater than the latter. For SKX this criterion has been met.


The earnings numbers of a company should be examined from various different angles. Three of these angles are stability in the trend of earnings, earnings persistence, and earnings acceleration. To evaluate stability, the stock has to pass the following four criteria.


CURRENT QUARTER EARNINGS: PASS

The first of these criteria is that the current EPS be positive. SKX's EPS ($0.67) pass this test.


QUARTERLY EARNINGS ONE YEAR AGO: PASS

The EPS for the quarter one year ago must be positive. SKX's EPS for this quarter last year ($0.56) pass this test.


POSITIVE EARNINGS GROWTH RATE FOR CURRENT QUARTER: PASS

The growth rate of the current quarter's earnings compared to the same quarter a year ago must also be positive. SKX's growth rate of 19.64% passes this test.


EARNINGS GROWTH RATE FOR THE PAST SEVERAL QUARTERS: FAIL

Compare the earnings growth rate of the previous three quarters with long-term EPS growth rate. Earnings growth in the previous 3 quarters should be at least half of the long-term EPS growth rate. Half of the long-term EPS growth rate for SKX is 10.88%. This should be less than the growth rates for the 3 previous quarters which are 47.62%, 1.43% and 68.97%. SKX does not pass this test, which means that it does not have good, reasonably steady earnings.


This strategy looks at the rate which earnings grow and evaluates this rate of growth from different angles. The 4 tests immediately following are detailed below.


EPS GROWTH FOR CURRENT QUARTER MUST BE GREATER THAN PRIOR 3 QUARTERS: FAIL

If the growth rate of the prior three quarter's earnings, 25.83%, (versus the same three quarters a year earlier) is greater than the growth rate of the current quarter earnings, 19.64%, (versus the same quarter one year ago) then the stock fails, with one exception: if the growth rate in earnings between the current quarter and the same quarter one year ago is greater than 30%, then the stock would pass. The growth rate over this period for SKX is 19.6%, and it would therefore fail this test.


EPS GROWTH FOR CURRENT QUARTER MUST BE GREATER THAN THE HISTORICAL GROWTH RATE: FAIL

The EPS growth rate for the current quarter, 19.64% must be greater than or equal to the historical growth which is 21.77%. Since this is not the case SKX would therefore fail this test.


EARNINGS PERSISTENCE: PASS

Companies must show persistent yearly earnings growth. To fulfill this requirement a company's earnings must increase each year for a five year period. SKX, whose annual EPS growth before extraordinary items for the previous 5 years (from the earliest to the most recent fiscal year) were 0.91, 1.50, 1.57, 1.78 and 1.85, passes this test.


LONG-TERM EPS GROWTH: PASS

One final earnings test required is that the long-term earnings growth rate must be at least 15% per year. SKX's long-term growth rate of 21.77%, based on the average of the 3, 4 and 5 year historical eps growth rates, passes this test.


TOTAL DEBT/EQUITY RATIO: PASS

A final criterion is that a company must not have a high level of debt. A high level of total debt, due to high interest expenses, can have a very negative effect on earnings if business moderately turns down. If a company does have a high level, an investor may want to avoid this stock altogether. SKX's Debt/Equity (5.64%) is not considered high relative to its industry (37.29%) and passes this test.


INSIDER TRANSACTIONS: PASS

A factor that adds to a stock's attractiveness is if insider buy transactions number 3 or more, while insider sell transactions are zero. Zweig calls this an insider buy signal. For SKX, this criterion has not been met (insider sell transactions are 15, while insiders buying number 9). Despite the fact that insider sells out number insider buys for this company, Zweig considers even one insider buy transaction enough to prevent an insider sell signal, therefore there is not an insider sell signal and the stock passes this criterion.


UNITED RENTALS, INC.

Strategy: Growth/Value Investor
Based on: James P. O'Shaughnessy

United Rentals, Inc. is a holding company. The Company is an equipment rental company, which operates throughout the United States and Canada. It operates through two segments: general rentals, and trench, power and pump. The general rentals segment includes the rental of construction, aerial, industrial and homeowner equipment and related services and activities. The trench, power and pump segment includes the rental of specialty construction products and related services. Its general rentals segment includes the rental of general construction and industrial equipment, such as backhoes, skid-steer loaders, forklifts and material handling equipment; aerial work platforms, such as boom lifts and scissor lifts, and general tools and light equipment, such as pressure washers, water pumps and power tools. As of October 17, 2018, it operated 1075 rental locations. It conducts its operations through its subsidiary, United Rentals (North America), Inc. (URNA) and subsidiaries of URNA.


MARKET CAP: PASS

The first requirement of the Cornerstone Growth Strategy is that the company has a market capitalization of at least $150 million. This will screen out the companies that are too illiquid for most investors, but still include a small growth company. URI, with a market cap of $12,268 million, passes this criterion.


EARNINGS PER SHARE PERSISTENCE: PASS

The Cornerstone Growth methodology looks for companies that show persistent earnings growth without regard to magnitude. To fulfill this requirement, a company's earnings must increase each year for a five year period. URI, whose annual EPS before extraordinary items for the last 5 years (from earliest to the most recent fiscal year) were 5.14, 6.07, 6.45, 7.68 and 13.19, passes this test.


PRICE/SALES RATIO: PASS

The Price/Sales ratio should be below 1.5. This value criterion, coupled with the growth criterion, identify growth stocks that are still cheap to buy. URI's Price/Sales ratio of 1.33, based on trailing 12 month sales, passes this criterion.


RELATIVE STRENGTH: PASS

The final criterion for the Cornerstone Growth Strategy requires that the Relative Strength of the company be among the top 50 of the stocks screened using the previous criterion. This gives you the opportunity to buy the growth stocks you are searching for just as the market is embracing them. URI, whose relative strength is 80, is in the top 50 and would pass this last criterion.


MONSTER BEVERAGE CORP

Strategy: P/E/Growth Investor
Based on: Peter Lynch

Monster Beverage Corporation develops, markets, sells and distributes energy drink beverages, sodas and/or concentrates for energy drink beverages, primarily under various brand names, including Monster Energy, Monster Rehab, Monster Energy Extra Strength Nitrous Technology, Java Monster, Muscle Monster, Mega Monster Energy, Punch Monster, Juice Monster, Ubermonster, BU, Mutant Super Soda, Nalu, NOS, Burn, Mother, Ultra, Play and Power Play, Gladiator, Relentless, Samurai, BPM and Full Throttle. The Company has three segments: Monster Energy Drinks segment, which consists of its Monster Energy drinks, as well as Mutant Super Soda drinks; Strategic Brands segment, which includes various energy drink brands owned through The Coca-Cola Company (TCCC), and Other segment (Other), which includes the American Fruits & Flavors (AFF) third-party products. The Strategic Brands segment sells concentrates and/or beverage bases to authorized bottling and canning operations.


DETERMINE THE CLASSIFICATION:

This methodology would consider MNST a "fast-grower".


P/E/GROWTH RATIO: FAIL

The investor should examine the P/E (32.32) relative to the growth rate (20.74%), based on the average of the 3, 4 and 5 year historical eps growth rates, for a company. This is a quick way of determining the fairness of the price. In this particular case, the P/E/G ratio for MNST (1.56) is too high to add to the attractiveness of the stock.


SALES AND P/E RATIO: PASS

For companies with sales greater than $1 billion, this methodology likes to see that the P/E ratio remain below 40. Large companies can have a difficult time maintaining a growth high enough to support a P/E above this threshold. MNST, whose sales are $4,107.8 million, needs to have a P/E below 40 to pass this criterion. MNST's P/E of (32.32) is considered acceptable.


INVENTORY TO SALES: PASS

When inventories increase faster than sales, it is a red flag. However an increase of up to 5% is considered bearable if all other ratios appear attractive. Inventory to sales for MNST was 7.59% last year, while for this year it is 7.29%. Since inventory to sales has decreased from last year by -0.30%, MNST passes this test.


EPS GROWTH RATE: PASS

This methodology favors companies that have several years of fast earnings growth, as these companies have a proven formula for growth that in many cases can continue many more years. This methodology likes to see earnings growth in the range of 20% to 50%, as earnings growth over 50% may be unsustainable. The EPS growth rate for MNST is 20.7%, based on the average of the 3, 4 and 5 year historical eps growth rates, which is considered very good.


TOTAL DEBT/EQUITY RATIO: PASS

This methodology would consider the Debt/Equity ratio for MNST (0.04%) to be exceptionally low (equity is at least ten times debt). This ratio is one quick way to determine the financial strength of the company.


FREE CASH FLOW: NEUTRAL

The Free Cash Flow/Price ratio, though not a requirement, is considered a bonus if it is above 35%. A positive Cash Flow (the higher the better) separates a wonderfully reliable investment from a shaky one. This methodology prefers not to invest in companies that rely heavily on capital spending. This ratio for MNST (3.04%) is too low to add to the attractiveness of the stock. Keep in mind, however, that it does not adversely affect the company as it is a bonus criteria.


NET CASH POSITION: NEUTRAL

Another bonus for a company is having a Net Cash/Price ratio above 30%. Lynch defines net cash as cash and marketable securities minus long term debt. According to this methodology, a high value for this ratio dramatically cuts down on the risk of the security. The Net Cash/Price ratio for MNST (2.72%) is too low to add to the attractiveness of this company. Keep in mind, however, that it does not adversely affect the company as it is a bonus criteria.


Watch List

The top scoring stocks not currently in the Hot List portfolio.

Ticker Company Name Current
Score
BMA BANCO MACRO SA (ADR) 86%
DHI D. R. HORTON INC 63%
BBAR BANCO BBVA ARGENTINA SA (ADR) 61%
MBT MOBIL'NYE TELESISTEMY PAO (ADR) 59%
CRTO CRITEO SA (ADR) 58%
TX TERNIUM SA (ADR) 57%
LPLA LPL FINANCIAL HOLDINGS INC 55%
CPRT COPART, INC. 55%
EME EMCOR GROUP INC 53%
GGAL GRUPO FINANCIERO GALICIA S.A. (ADR) 52%


Disclaimer

The names of individuals (i.e., the 'gurus') appearing in this report are for identification purposes of his methodology only, as derived by Validea.com from published sources, and are not intended to suggest or imply any affiliation with or endorsement or even agreement with this report personally by such gurus, or any knowledge or approval by such persons of the content of this report. All trademarks, service marks and tradenames appearing in this report are the property of their respective owners, and are likewise used for identification purposes only.

Validea is not registered as a securities broker-dealer or investment advisor either with the U.S. Securities and Exchange Commission or with any state securities regulatory authority. Validea is not responsible for trades executed by users of this site based on the information included herein. The information presented on this website does not represent a recommendation to buy or sell stocks or any financial instrument nor is it intended as an endorsement of any security or investment. The information on this website is generic by nature and is not personalized to the specific situation of any individual. The user therefore bears complete responsibility for their own investment research and should seek the advice of a qualified investment professional prior to making any investment decisions.

Performance results are based on model portfolios and do not reflect actual trading. Actual performance will vary based on a variety of factors, including market conditions and trading costs. Past performance is not necessarily indicative of future results. Individual stocks mentioned throughout this web site may be holdings in the managed portfolios of Validea Capital Management, a separate asset management firm founded by Validea.com founder John Reese. Validea Capital Management, which is a separate legal entity and an SEC registered investment advisory firm, uses, in part, the strategies on the web site to select stocks for its clients.